Dividend Safety - How secure is your next dividend payment?
As an investor in any business dividend safety should be one of your main concerns. Dividends are not mandatory payments. Unlike bond coupons, they can be canceled or lowered.
Here are two key indicators to look for to help you identify how safe your dividend payments are likely to be before you invest.
Firstly earnings. Take a look at both the earnings per share (EPS) and dividend per share (DPS). For example, if the company you're looking at is earning $5 per share and is paying $2.50 per share we would say the dividend cover is 2x or the dividend payout ratio is 50%.
We would consider this as a pretty safe dividend, as the company has plenty of extra cash to invest elsewhere alongside paying its stockholders. Dividends depend on both earnings and cash flow, however, so you should consider both of these.
That said - be careful with earnings!
When considering dividend safety, you can't just look at one year's worth of EPS and infer whether the dividend is safe or not. You need to consider several years' worth of earnings.
Maybe the company you're looking at is cyclical and last year's earnings reflect a strong performance when the outlook for this year may be considerably worse (for example an oil company after a drop in the price of crude).
Furthermore, the earnings may be skewed by one-off events. Positive one-off events that could (temporarily) boost earnings may include the sale of a subsidiary or a tax rebate.
Negative one-off events that could harm earnings may include impairment to assets or a re-structuring following the closing of a store or factory.
If you look at earnings over many years, you should be able to take an average and infer from that number what the "true" earning power of the company is. Ideally, you would also hope to see an upward trend in the EPS.
You could also look at what the company's management says. Sometimes they will talk about "core earnings" or "operating profits".
This is meant to be help you strip out one-off adjustments but we would always recommend researching what they are stripping out and use your judgment on whether you think it really is a "one-off" event or whether such events are becoming little more frequent than that.
Remember, the company's CEO and board will be paid partly in stock, so they often like to paint a positive view of the company's earning potential.
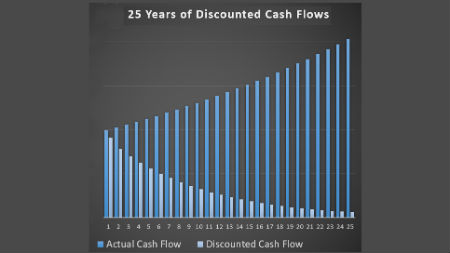
Beyond earnings, you should consider cash flow when judging dividend safety, as this is what dividends, in the long run, are paid from. In particular we concentrate on free cash flow.
What is free cash flow?
Free cash flow is the operating cash flow of the business minus the capital expenditure. Operating cash flow is net profit with non-cash charges such as depreciation and amortization added back.
Capital expenditure (CAPEX) is cash spent on an investment made during the year. This expenditure is added as an asset to the company's balance sheet on day one and then depreciated over the useful life of the asset. The depreciation will show up as a cost on the income statement through that lifetime.
As the cost associated with this depreciation was spent when the capital expenditure was made, this will be a non-cash charge in future years.
For many businesses capital expenditure is very important to maintain their current operations and not allow their assets to become useless. This is why we would be very cautious about using EBITDA as a number.
The fact is that depreciation is a very real cost of doing business and you should look carefully at the depreciation/amortization numbers and compare to the current CAPEX numbers.
Where does this fit in with dividend safety?
Once you have a free cash flow number, you know how much cash is available to management to distribute to shareholders. With this free cash, the management have several options. They can make acquisitions, they can re-pay debt, they can buy back shares, or they can pay dividends.
When assessing dividend safety, you should look at the cash flow statement over several years and see whether the free cash flow is comfortably covering the cost of the dividend. If this is easily covered, then you can feel somewhat assured on the dividend safety.
In our article on dividend payout ratio, we used the example of Pepsico to assess their dividend safety. Let's look at the numbers again here:
|
(all figures in millions) |
2015 |
2014 |
2013 |
*Pepsico states that their cash flow is $8.1bln but they warn us to exclude restructuring charges and add back the sale of property, plant and equipment. We always like to be more conservative than management, so have used our own calculation for free cash flow.
Unforeseen circumstances aside, this cash flow statement should be fairly reassuring to the investor of Pepsico's dividend safety.
Got a BURNING dividend question for 6-figure dividend earner Mike Roberts?
What is it that you really want to know about investing?
Submit a query and Mike will write a page in response.
PLEASE NOTE - in accordance with our terms of use, responses are meant for education / interest only. We do not give specific financial advice.

Dividend Investors' Detox Newsletter
Tired of constantly reading about speculative and risky trading strategies? Struggling to find serious long-term investing ideas?
Get a "detox" with our newsletter devoted to buy-and-hold dividend growth investment (the Warren Buffett way).
For research on companies with consistent dividends and tips to keep you on the "steady path" to a serious income, sign up today...
For more information and back issues, click here
Recent Articles
-
Focusrite TUNE Dividend
Jun 20, 22 07:52 AM
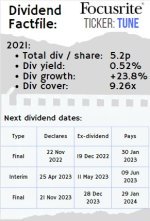 Focusrite TUNE dividend factfile and information for investors
 -
amount of dividend on an eta?
Sep 06, 20 09:04 AM
If I bought QQQ Dec 2011 with the amount invested as $8,890.00 what would the dividend amount be today? -
Gear modestly
Sep 06, 20 08:57 AM
Peter says to buy 1 year worth of dividends with a loan (say a margin loan for example if dont have a house). So If I buy $1000 of xyz company that pays